Emissions and Precursors Trends
Ozone precursors
Ozone is not directly emitted from emission sources. It is a product of complex photochemical reactions and involves two precursors: volatile organic compounds (VOC) and oxides of nitrogen (NOX). To evaluate ozone, the District evaluates the emissions of VOC and NOX. The emissions inventory graphs show the VOC and NOX trends from 2000 to 2032 (forecasted) during the summer months (May through October). Summer is typically when ozone concentrations are the highest. The emission trends show significant declines in emissions, despite increasing population, vehicle activity, and economic development. The drop in ozone precursors corresponds to a decrease in ozone concentrations.
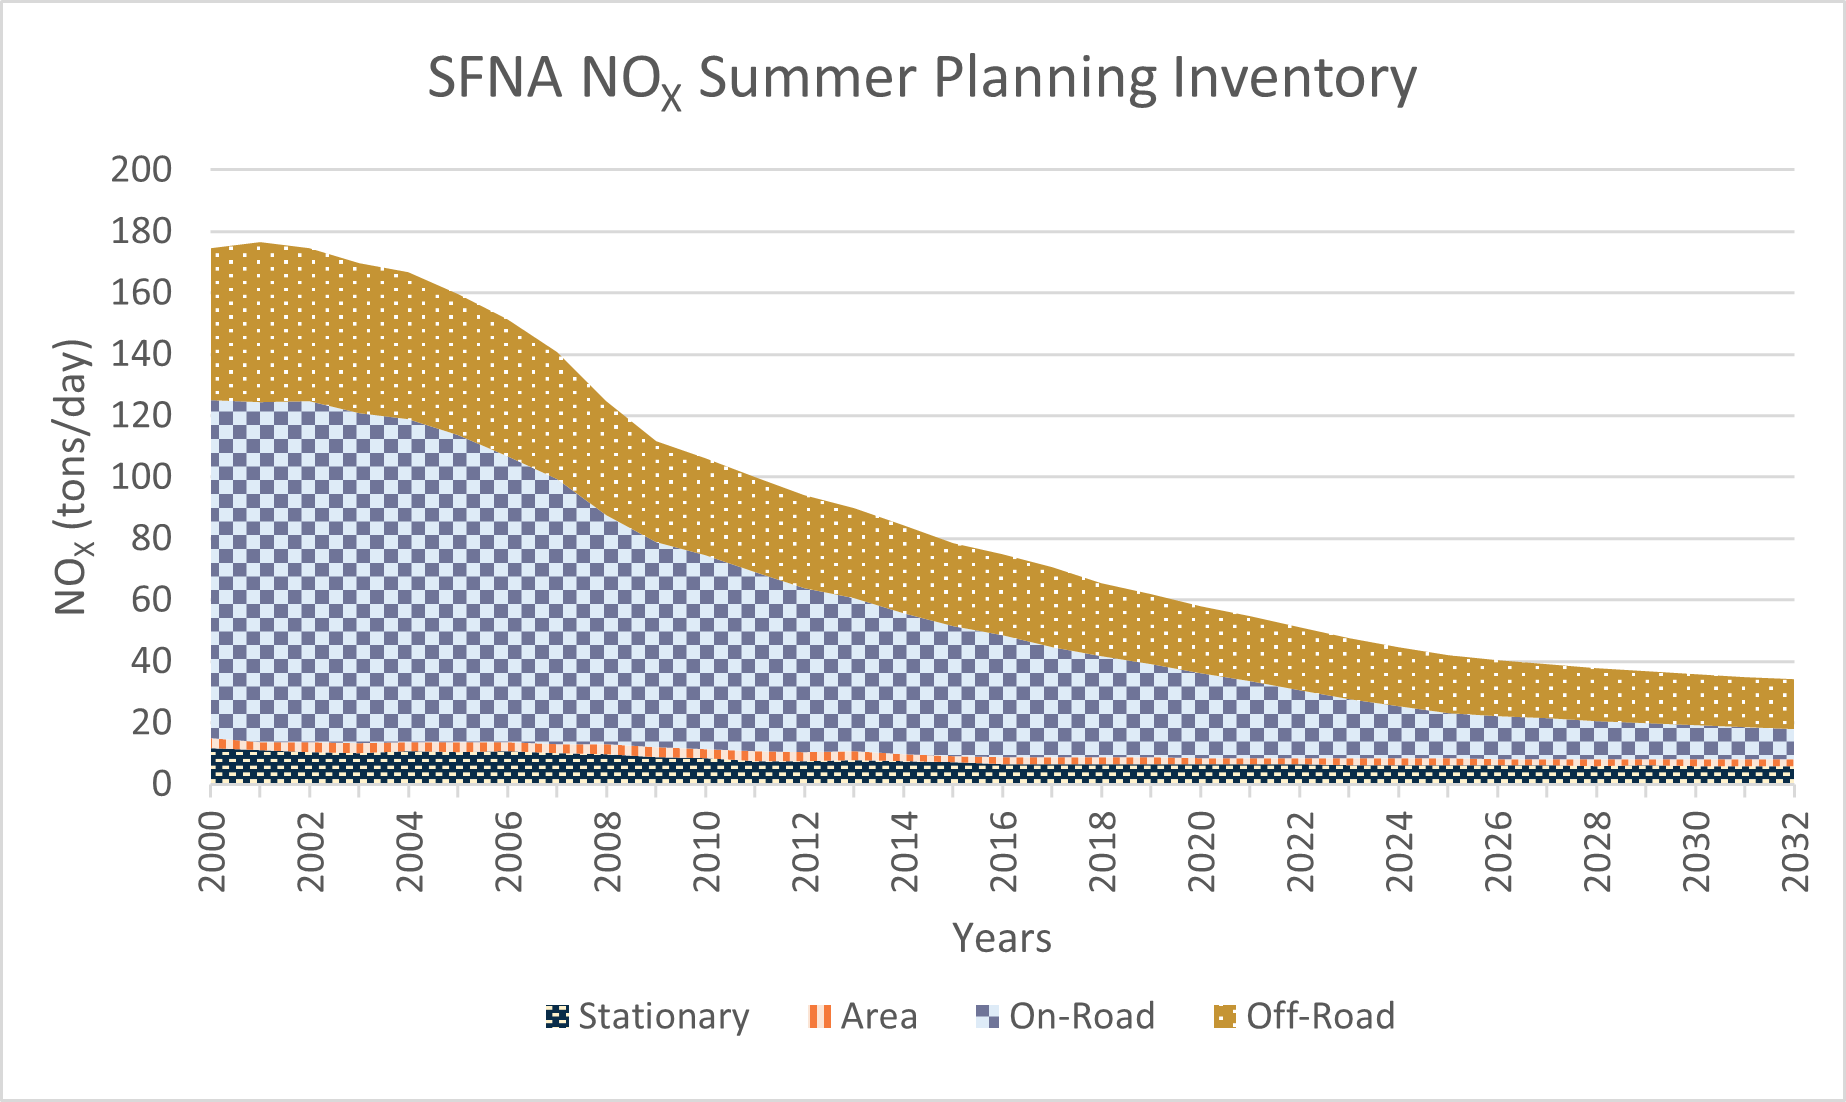
 Data source CEPAM: 2019 SIP
Baseline Emission Projections, Emission Projections with External Adjustments, Sacramento
NAA 2019 Ozone SIP Version 1.04
Data source CEPAM: 2019 SIP
Baseline Emission Projections, Emission Projections with External Adjustments, Sacramento
NAA 2019 Ozone SIP Version 1.04
Fine Particulate Matter and Precursors
Fine particular matter can be emitted directly or formed by chemical reactions of precursors - nitrogen oxide (NOX), sulfur dioxide (SO2), volatile organic compounds (VOCs), and ammonia (NH3). This figure shows how much precursor emissions have decreased since 2005, and the emissions are expected to continue to decrease in the future despite an increase in population and economic growth.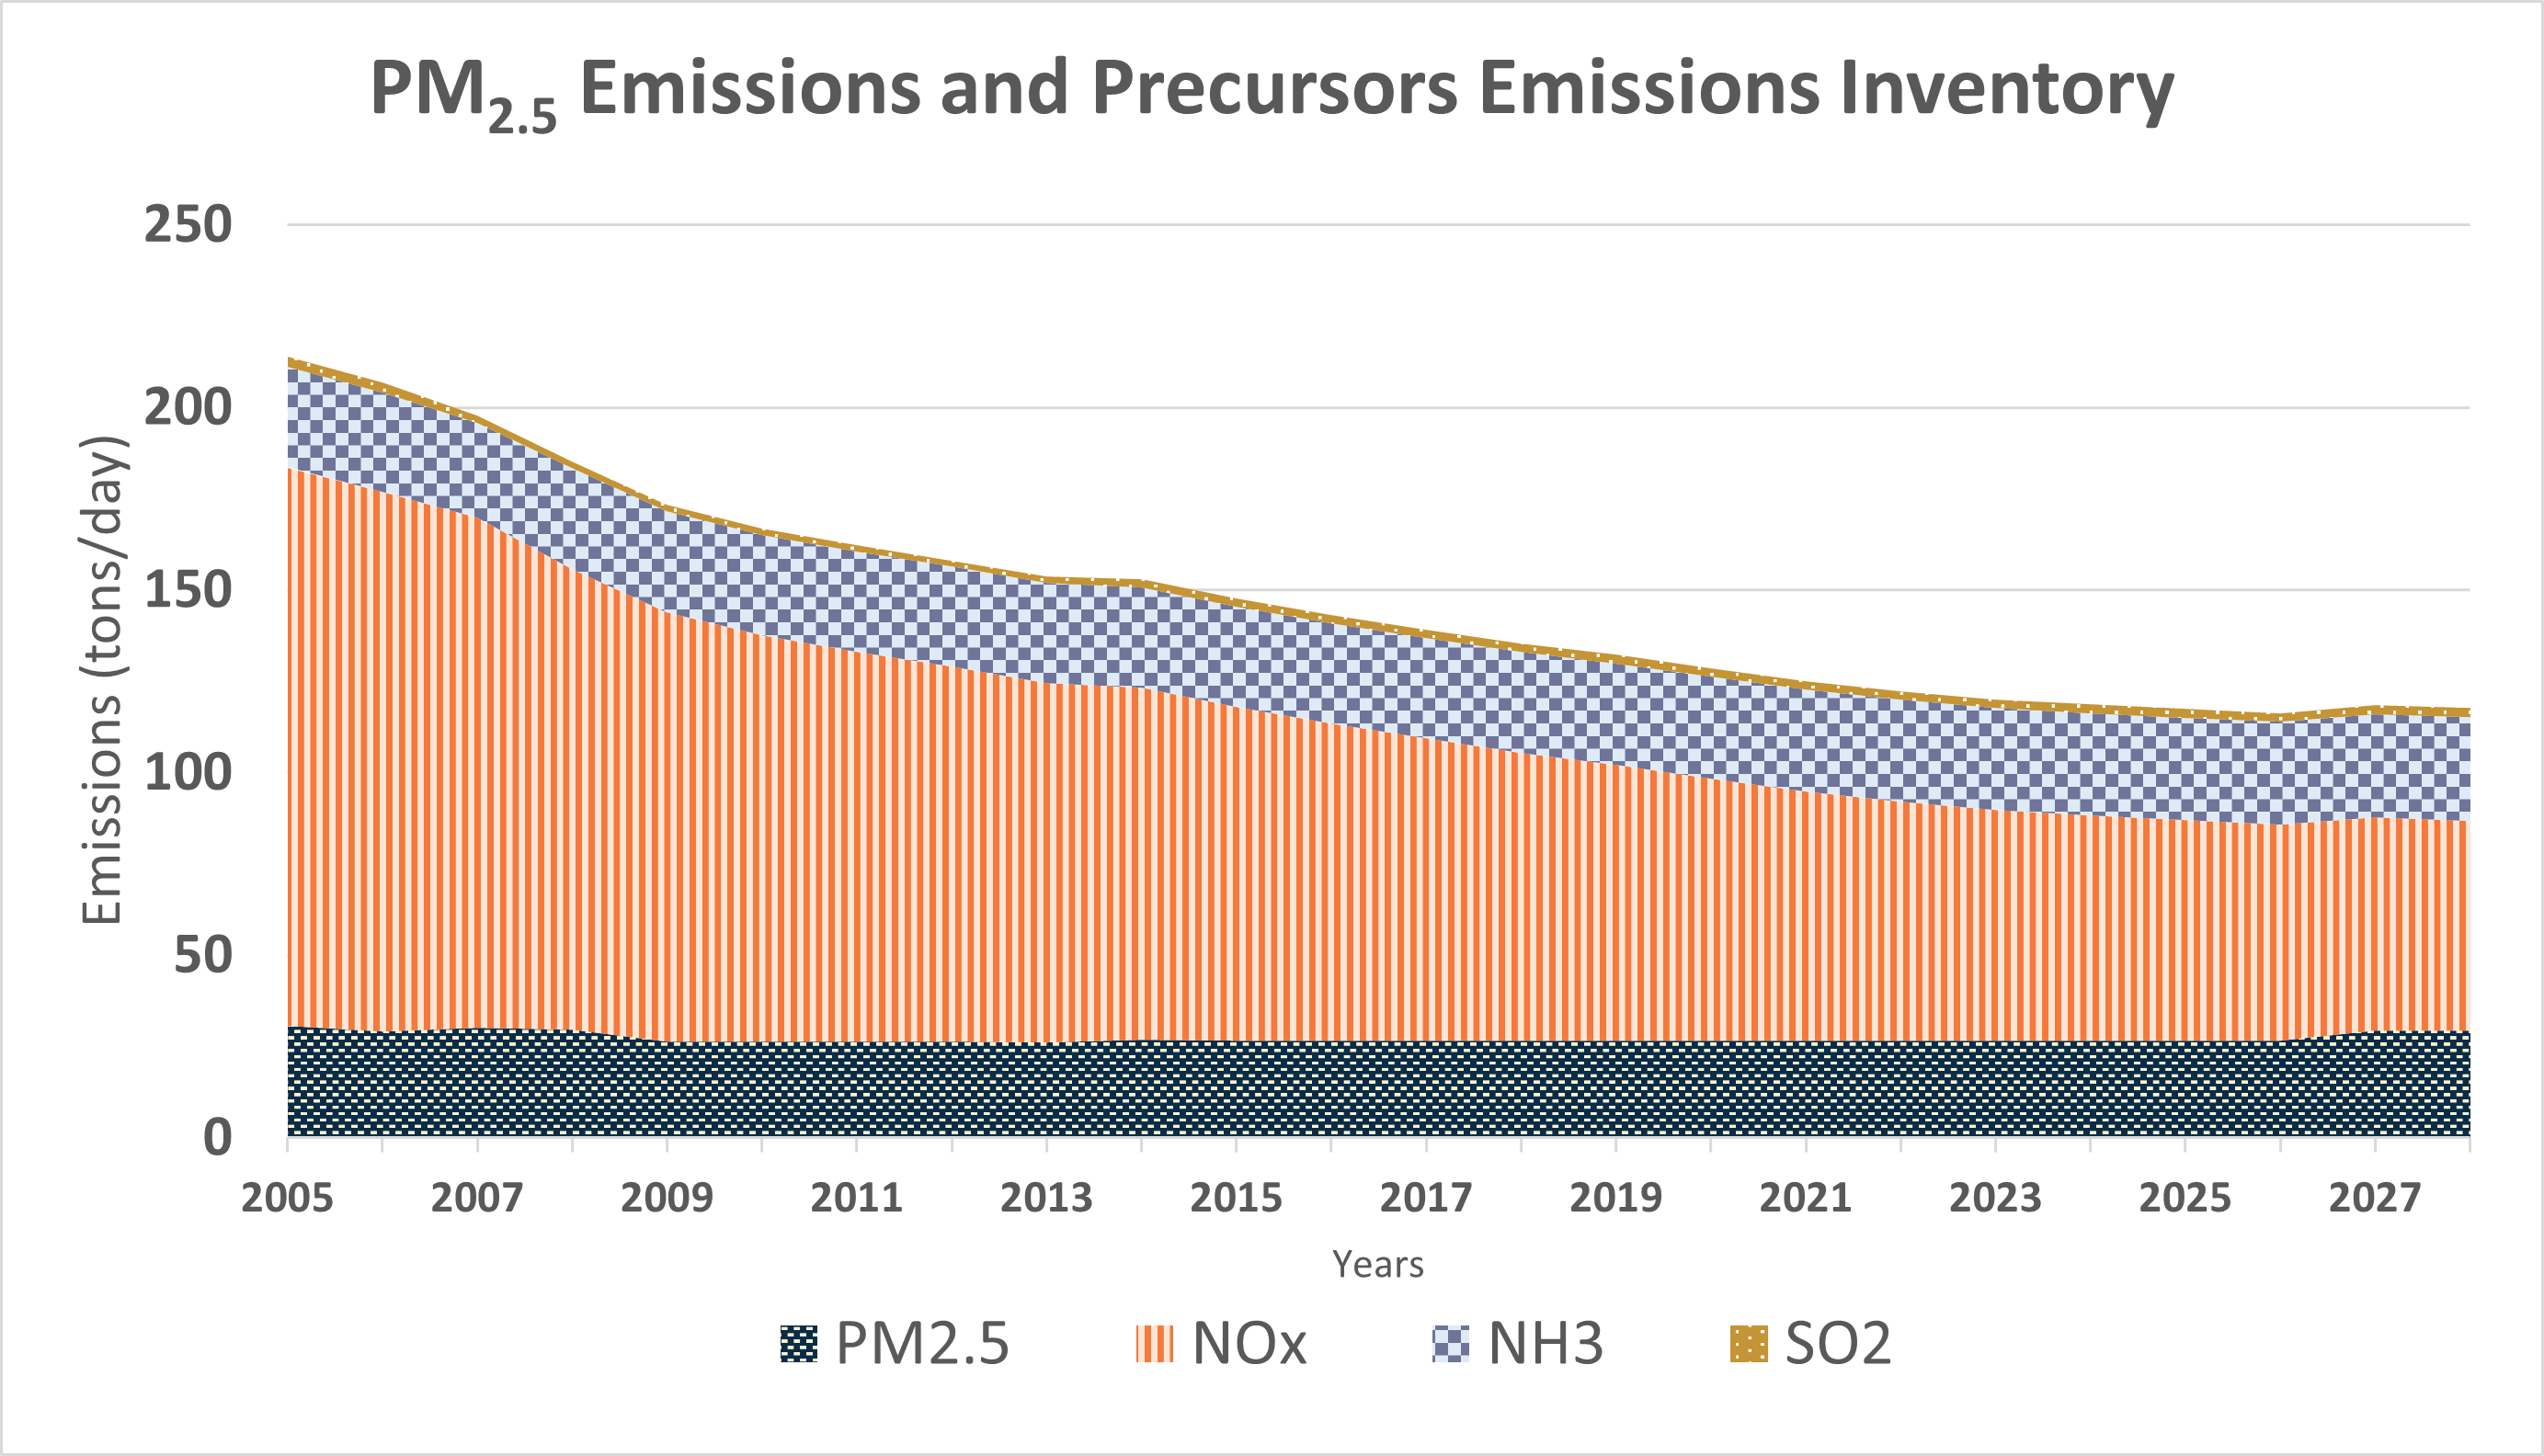
Data Source: CEPAM: NORCAL 2012 PM2.5 SIP Baseline Emission Projections, Section a1 – Emission Projections with External Adjustments, Sacramento Nonattainment Area 2012 PM2.5 SIP Version 1.01.
Composition of the PM2.5 and precursor NOX emissions in Sacramento County
The pie charts below show the 2024 emissions source category of direct PM2.5 emissions and precursor NOX emissions in Sacramento County. NOX reacts with ammonia and water moisture in the air to form secondary particulate matter. Residential Wood burning is the major source of direct PM2.5 emissions and mobile sources emissions are major components of NOX emissions in Sacramento County.
 |  |
Data Source:
NORCAL 2012 PM2.5 SIP Baseline Emission Projections, Section a1 – Emission Projections with External Adjustments, Sacramento Nonattainment Area 2012 PM2.5 SIP Version 1.01.